|
|
 |
|
 |
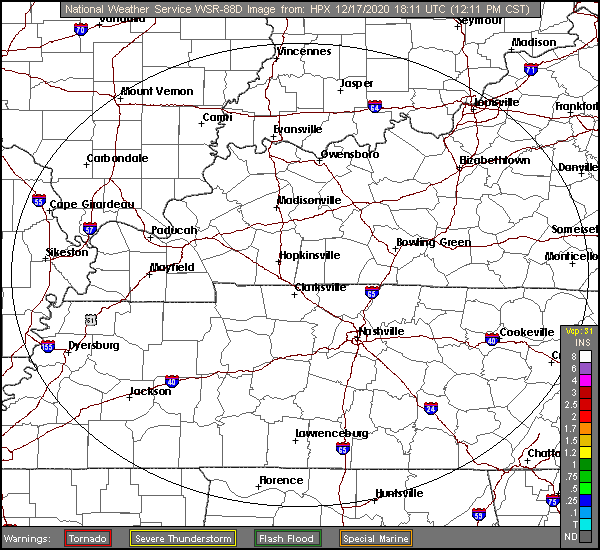
Radar Images for Clarksville TN
Fort Campbell KY and Montgomery County Tennessee |
|
|
 |
|
|
|
| |
|
|
Radar Images |
| |
Click on smaller radar images for a higher resolution view
Static image |
| Lower Mississippi Valley |
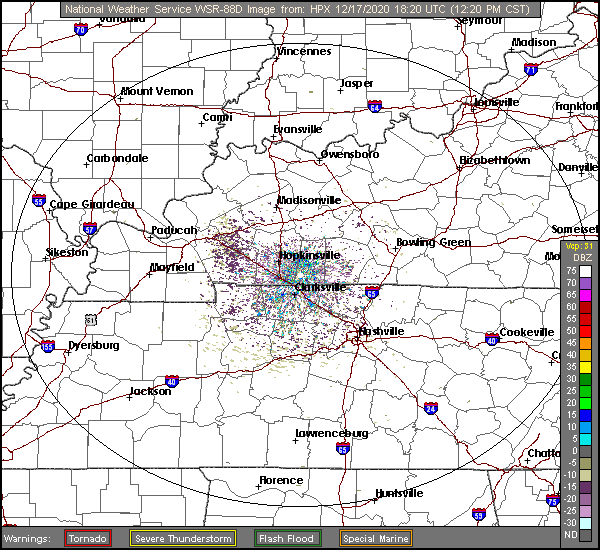
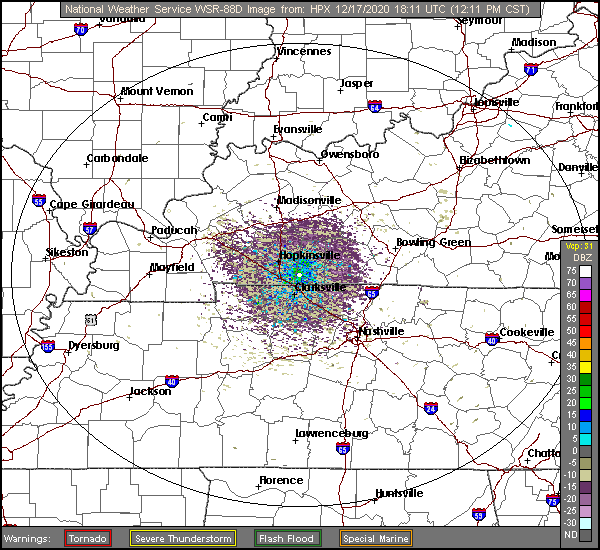
Base Reflectivity (Range 143mi)  to red (extreme) that indicate the intensity of precipitation. Legend associates colors with intensity. Range 143 miles") |
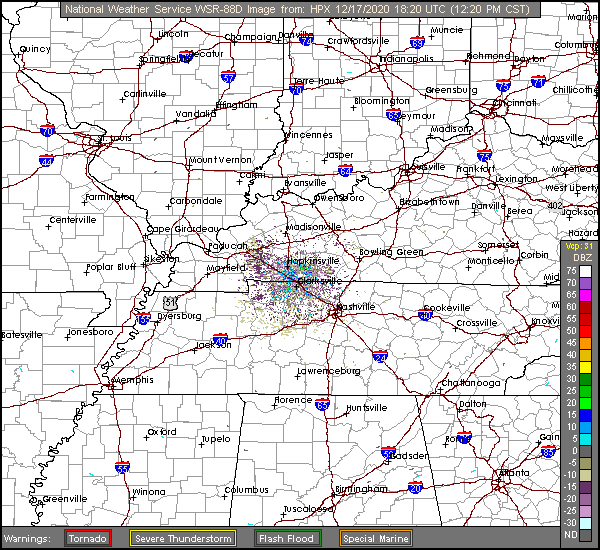
Base Reflectivity (Range 243mi) |
|---|
 |
Loop
|
Loop
|
| Composite Reflectivity |
|
Loop
|
|
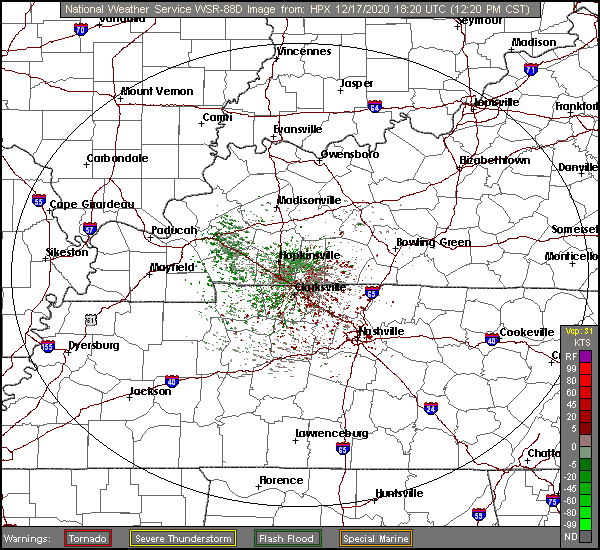
| Base Velocity
|
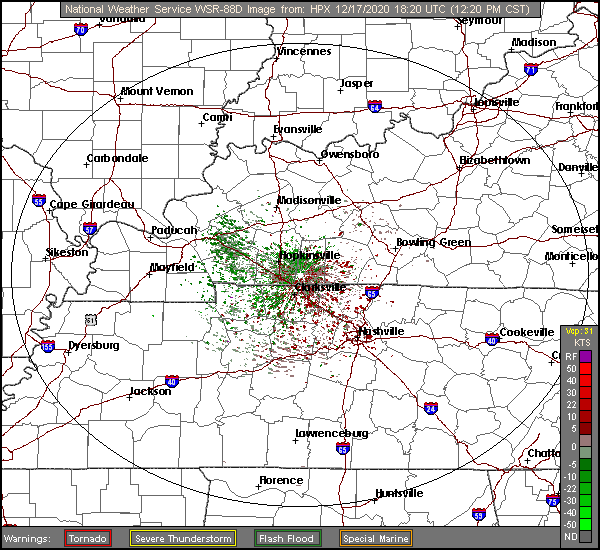
Storm Relative Motion |
Echo Tops |
Loop
|
Loop
|
Loop
|
| One-Hour Precipitation |
Storm Total Precipitation |
Vertical Integrated Liquid |
Loop
|

Loop
|

Loop
|
|
|
|
|
|
| |
|
|
|
| |
|
|
 |
|
|
|
|
|
|
|
| |
| |

|